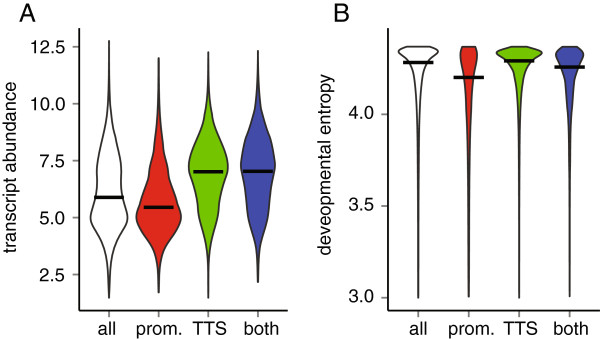
Figure 4.

Genes with H3.3-enriched nucleosomes in the promoter have weak expression but strong regulation. (A) Transcript abundance for all genes (white), genes with H3.3-enriched nucleosomes in the promoter (red), close to the TTS (green) or both (blue). Expression data are from [22] and in logarithmic scale. (B) Expression entropy for all genes (white), genes with H3.3-enriched nucleosomes in the promoter (red), close to the TTS (green) or both TTS (blue). Expression entropy is based on data from [26]. Horizontal bars indicate median values.
