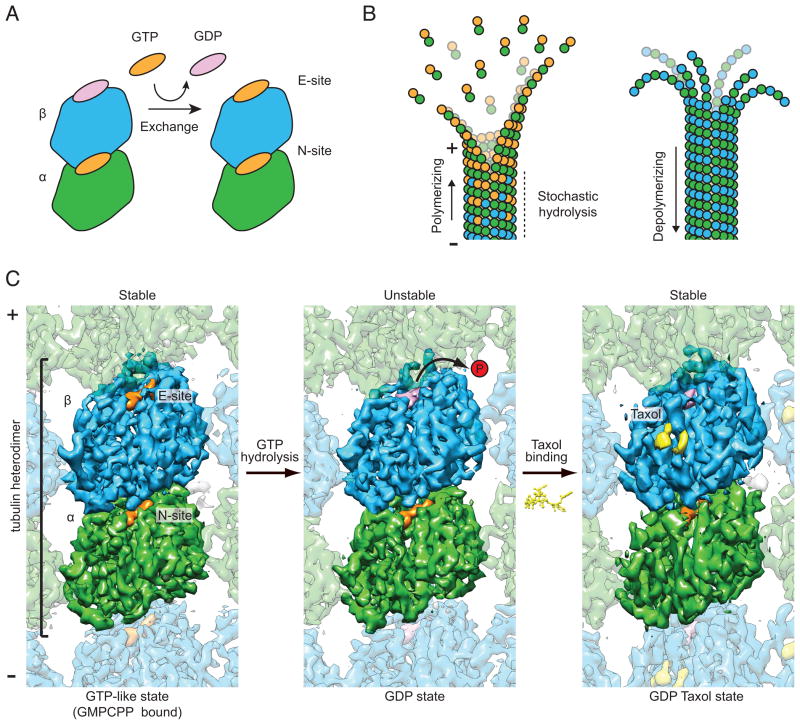
Figure 1. High-resolution cryo-EM structures of dynamic and stabilized microtubules.
A) Cartoon of the αβ–tubulin dimer, which spontaneously exchanges bound GDP for GTP in solution. B) Cartoon illustrating structural intermediates of microtubule polymerization and depolymerization. C) Cryo-EM maps of GMPCPP (left panel, 4.7 Å resolution), GDP (middle panel, 4.9 Å resolution) and taxol-stabilized (right panel, 5.6 Å resolution) microtubules, viewed from inside the microtubule lumen. α-tubulin, green, β-tubulin, blue, GMPCPP/GTP, orange, GDP, pink, taxol, yellow. Maps are contoured at 1.1 σ. (See also Table S1a, Figures S1 and S2 and Movies S1, S2 and S3)

