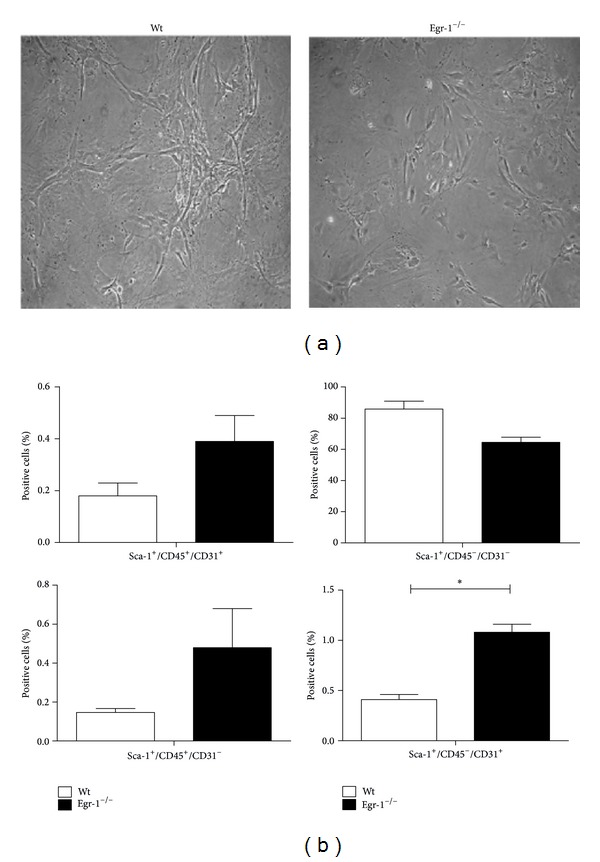
Figure 1.

(a) Optical images of cMSCs derived from wt and Egr-1−/− mice showing no difference in cell morphology. Magnification 10x. (b) Immunophenotype of wt and Egr-1−/− cMSCs. FACS analysis histograms display that, among the four subsets, only the percentage of Sca-1+/CD45−/CD31+ cells was higher in Egr-1−/− than in wt cMSCs. *P < 0.05. The error bars represent the SD.
