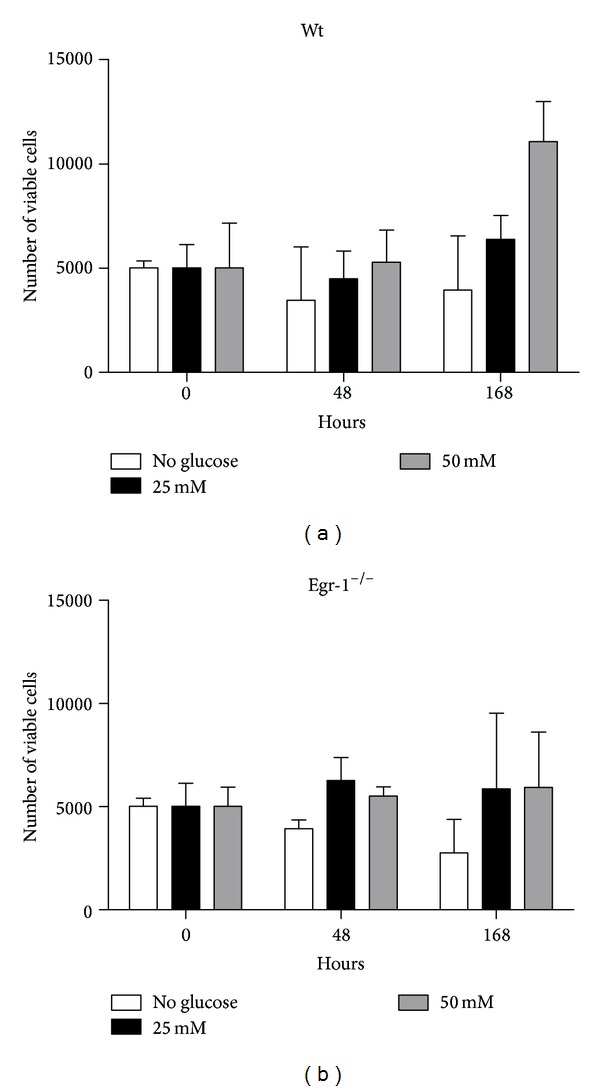
Figure 2.

Cell proliferation of cMSCs subjected to glucose variations in culture and in presence of 0.2% FBS and measured by Trypan Blue exclusion assay by counting viable cells. No significant difference in cell proliferation can be observed either at increased concentrations or time exposure of glucose and between wt and Egr-1−/− cMSCs. The error bars represent the SD.
