
Figure 4.
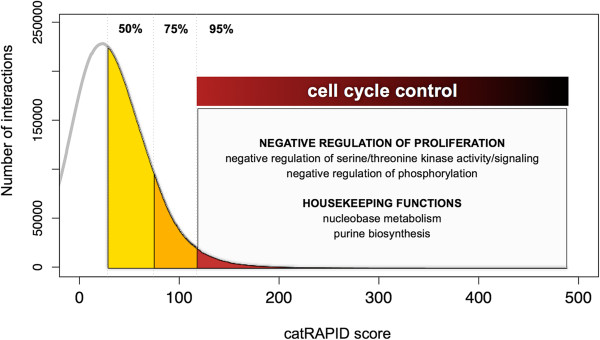
GO enrichment for interacting mRNA–RBP pairs correlated in expression (IC subset). Using the catRAPID score distribution, we counted mRNA GO enrichment associated with different areas under the curve (see Materials and methods). The color gradient (yellow to red) indicates the AUC values (number of interactions: 20,702,804 for AUC > 50%, 10,351,402 for AUC > 75%, 2,070,280 for AUC > 95%). We found that cell cycle processes have more highly interacting mRNA–RBP pairs (AUC > 95%) that are correlated in expression. AUC, area under the curve; GO, gene ontology; IC, interacting and co-expressed; RBP, RNA-binding protein.