
Figure 2.
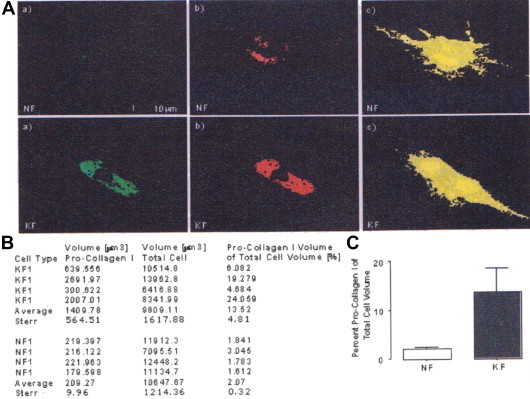
Pro-collagen I expression in normal and keloid fibroblasts analyzed by Volocity software. A. Representative xy-planes of original three-dimensional confocal images: a) original confocal image, b) volumetric measurement of intensely stained collagen clusters by threshold exclusion, and c) volumetric measurement of total cell volume using complete threshold. B. Summary table of volumetric Volocity data, four representative normal (NF) and keloid (KF) cells were analyzed. C. Bar graph represents mean percent pro-collagen I volume of four analyzed NF and KF cells compared to total cell volume with standard error shown. Statistical analysis was done using a two-tailed unpaired student's t-test. p <0.05 was used as a criterion for significance.