
Figure 6.
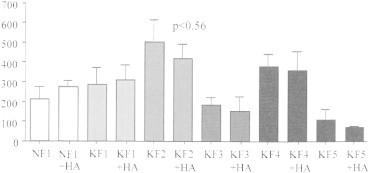
TGF-b1 secretion in normal and keloid fibroblasts. Quantikine© ELISA analysis of active TGF-b1 release into the cell culture media. Graph represents concentration [pg/ml] of active TGF-β1 into cell culture media of normal (NF1) and keloid (KF1, KF2, KF3, KF4, KF5) fibroblasts with (+HA) or without 72 hour hyaluronic acid treatment. Statistical analysis was done using a two-tailed unpaired student's t-test. p <0.05 was used as a criterion for significance.