
Figure 2.
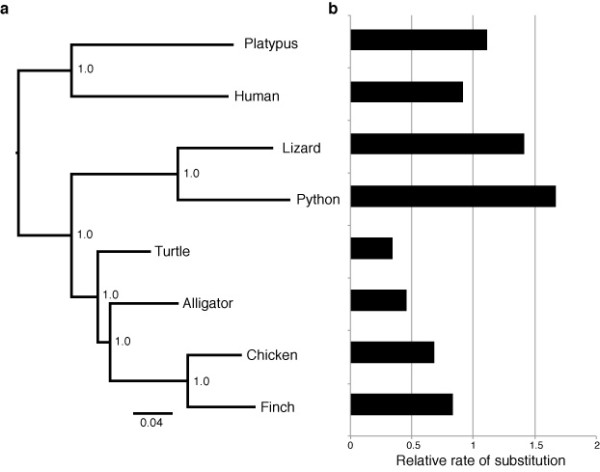
A revised phylogeny of major amniote lineages and their rates of molecular evolution. (a) Bayesian phylogram depicting the relationships of the eight primary amniote lineages, and their rates of molecular evolution. The phylogeny demonstrates the sister group relationship of turtle and archosaurs (allligator plus birds). The numbers at nodes denote posterior probabilities (all are at the maximum of 1.0). (b) The histogram shows the relative rate of substitution inferred for each lineage under a relaxed clock. For analysis details, see Materials and Methods, Phylogeny and substitution rate).