
Figure 5.
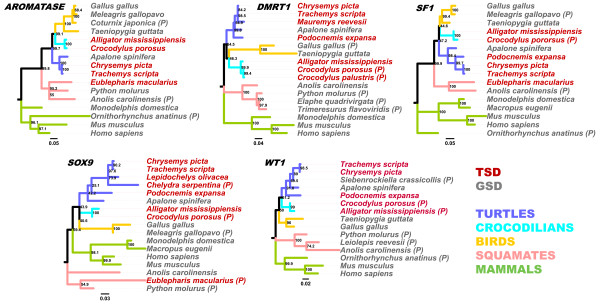
Maximum likelihood estimates of the phylogenetic relationships among taxa for five genes involved in gonadogenesis. Branch lengths are proportional to the number of substitutions per site; numbers at nodes are bootstrap proportions based on 500 pseudoreplicates. Colored branches denote the taxonomic group for each taxon. Tip font colors denote sex-determining mechanisms (red = TSD, gray = GSD). For all species, the full coding region was utilized except where only partial sequences were available, in which case the tip is denoted as (P).