
Figure 2.
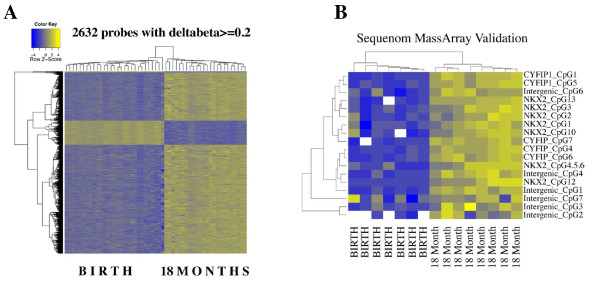
Characterization of age-associated changes in DNA methylation. (a) Heatmap of age-associated differentially methylated probes. Rows represent probes, columns represent samples. Cells are colored according to level of methylation (blue, hypomethylated; yellow, hypermethylated). Most age-associated changes involve an increase in methylation. (b) Heatmap of Sequenom EpiTyper validation data. Rows represent assayed CpG sites, columns represent samples. Cells are colored as in (a). Increases in methylation with age mirror those shown in (a).