
Figure 2.
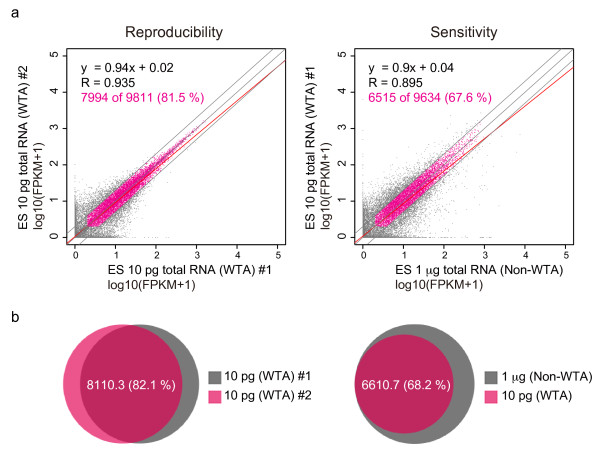
Reproducibility and sensitivity of single-cell Quartz-Seq. (a) Representative scatter plot of the gene-expression data from two replicate single-cell Quartz-Seq analyses of 10 pg of total embryonic stem (ES)-cell RNA (left panel). The blue line indicates a two-fold change, and the red line is a linear regression. Scatter plot of single-cell Quartz-Seq (whole-transcript amplification; WTA) and conventional RNA-seq (non-WTA) data using 1 µg of total ES-cell RNA (right panel). (b) Ratio of detected genes for three replicate Quartz-Seq analyses. Using two different independent Quartz-Seq experiments, 82.1% of the genes were detected by (left panel). The right panel shows the ratio of the genes detected by Quartz-Seq and conventional RNA-seq; more than 68.2% of the genes were detected by single-cell Quartz-Seq.