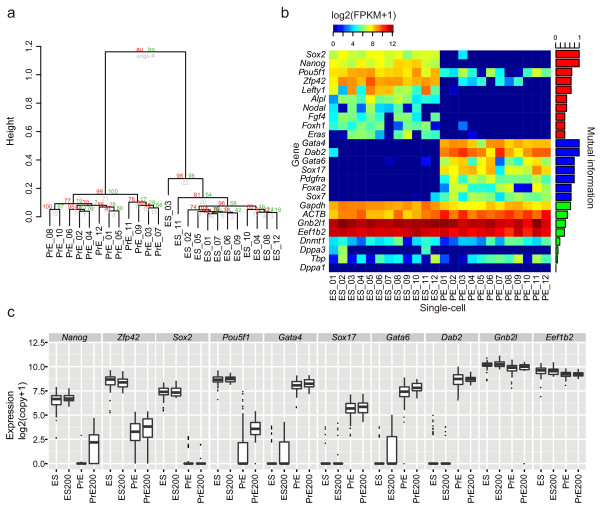
Figure 4.

Single-cell Quartz-Seq detects different cell types. Results of single-cell Quartz-Seq with 12 embryonic stem (ES) cells and 12 primitive endoderm (PrE) cells. (a) Clustering of all samples. (b) Heat map of the marker genes for ES and PrE cells and the housekeeping genes. The bar plot in the right panel shows the mutual information (MI); a high degree of MI indicates high differential expression between two cell states. (c) Verification of the expression pattern between single cells using amplification-free single-cell quantitative (q)PCR. The gene-expression data for single cells correspond to the ES (n = 96 single ES cells in the G1 phase of the cell cycle), PrE (n = 96 single PrE cells in the G1 phase), ES200 (n = 40 single-cell-sized samples from pooled lysis of ES cells in the G1 phase), and PrE200 (n = 40 single-cell-sized samples from pooled lysis of PrE cells in the G1 phase) groups. The ES and PrE box plots represent the gene-expression variability, which includes the biological variability and the experimental error, while the ES200 and PrE200 box plots represent the gene-expression variability due to experimental error.
