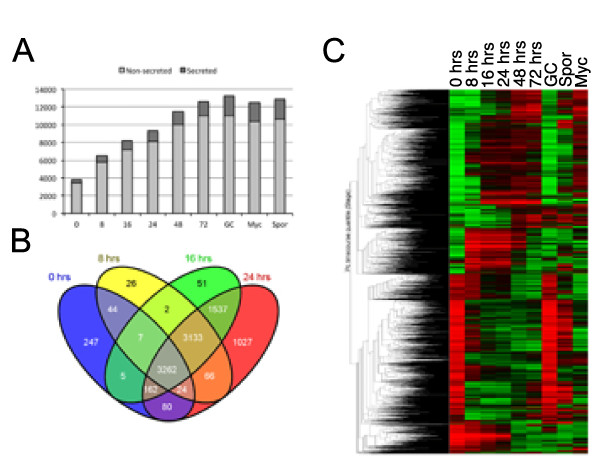
Figure 2.

Expression of Phytophthora capsici gene complement during infection and disease progression. (A) Overview of genes that were expressed as detected on the P. capsici-tomato two-genome microarray. The proportion of genes encoding putative secreted proteins (effectors) are indicated by dark grey. (B) Assessment of overlap of genes expressed in infectious stages and (C) overall assessment of differentially expressed P. capsici genes, determined by ANOVA as described in the text. Red and green represent upregulated and downregulated genes respectively. The y-axis shows average linkage of Pearson correlations of gene-expression profiles. The Venn diagram was generated using Venny [49].
