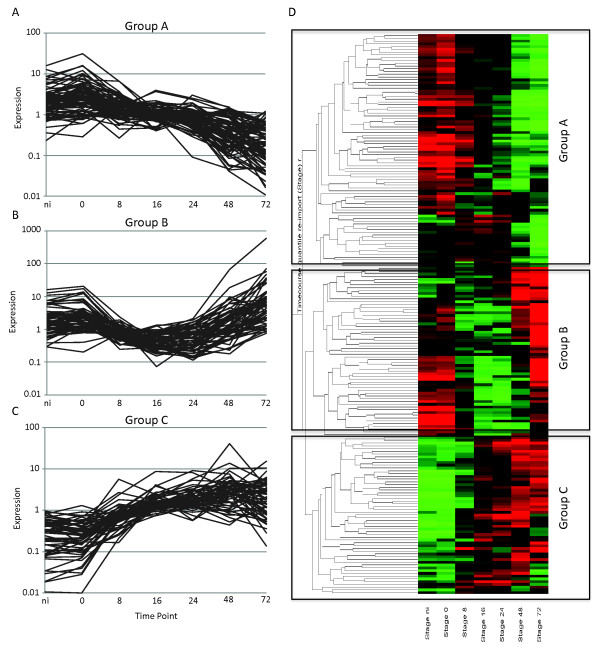
Figure 7.

Differentially expressed immune signaling candidate genes identified in microarray analyses. Overview of differentially expressed immune signaling candidate genes identified in pairwise comparisons between time points (Student's t-test) and ANOVA (P = 0.005) analyses. (A-C) Expression profiles are presented for class A, B, and C genes, identified by (D) cluster analyses in Genespring. Red and green represent upregulated and downregulated genes respectively. The y-axis shows average linkage of Pearson correlations of gene-expression profiles. The non-infected (Ni) tissue was a water-inoculated control sample.
