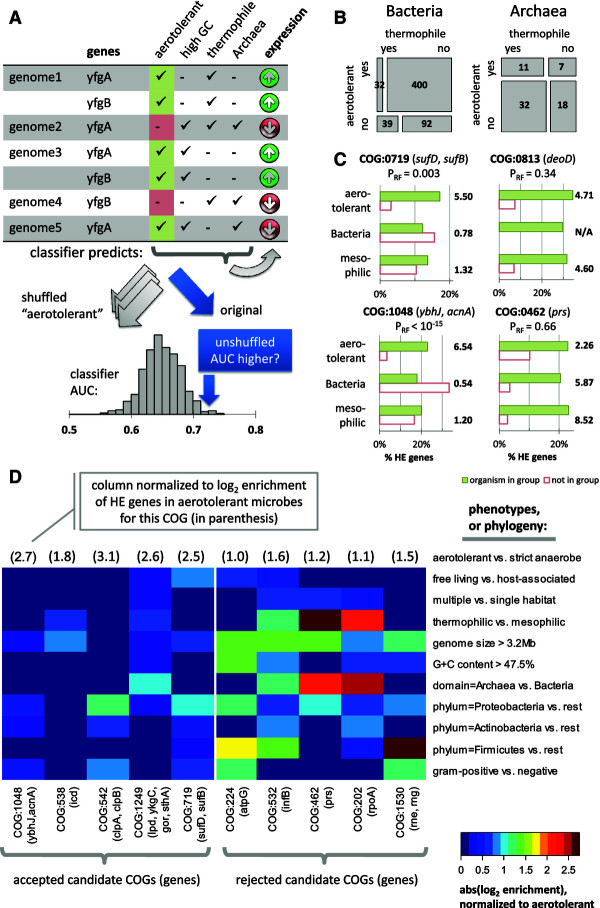
Figure 2.

Enrichment for highly expressed (HE) genes in gene families across microbial phenotypic groups. (A) Phenotypes were tested for an independent contribution to predicting expression levels within a gene family, after controlling for 24 other phenotypes, 6 genomic descriptors, and 70 phylogenetic subdivisions using a Random Forest (RF) randomization test (see Additional file 1). (B) An example of correlation between two phenotypes (here, thermophilicity and aerotolerance), and their correlation with taxonomy. The area of the rectangles is proportional to the number of genomes in each subgroup (overlaid). (C) Enrichment with HE genes in four example clusters of orthologous groups (COG) gene families in aerotolerant microbes versus obligate anaerobes, compared with HE enrichments in two other aerotolerance-correlated traits: genomic G + C content and thermophilicity. The ‘accepted’ COGs (left) have stronger HE enrichments for aerotolerance than for the other traits, whereas the HE enrichment in the ‘rejected’ COGs (right) can be more easily explained both by the aerotolerance and by another trait. (D) Enrichment of example COGs with HE genes in 10 groups of microbes defined through phenotypic traits, genomic features (GC, size) or taxonomy. The COGs shown all have Escherichia coli representative genes, and were found to have at least a twofold enrichment in HE genes in aerotolerant microbes compared with obligate anaerobes (P < 0.01, Fisher’s exact test). Left block shows the five HE-enriched genes with the most significant P-values in the RF randomization test for confounding phenotypes/phylogeny, while the right block shows the genes with the least significant P-values in this test. The more significant COGs tended to be less HE-enriched in other phenotypes or phylogenetic groups relative to the HE enrichment in aerotolerant microbes. Thus, the aerotolerant phenotype contains the information about the HE enrichment of genes within these particular COGs that cannot be recovered from the other traits.
