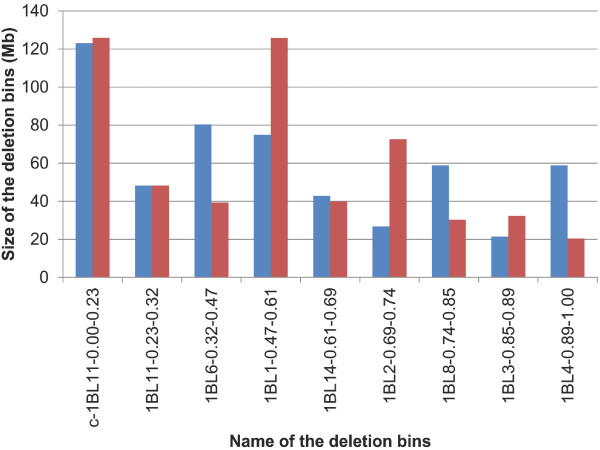
Figure 2.

Comparison of the size ofnine deletion bins along chromosome 1BL using cytogenetic and physical estimations. The cytogenetic and physical estimates are provided in blue and red, respectively. The size of each bin is provided on the Y axis in Mb. Bins are ordered from the left to the right along the centromere-telomere axis.
