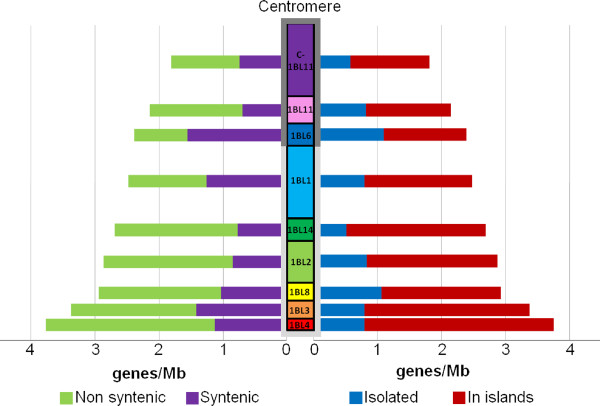
Figure 4.

Gene distribution along wheat chromosome 1BL. The gene density in each of the nine deletion bins is indicated in gene/Mb on each side of the schematic representation of the chromosome. The left end side presents the relative percentage of syntenic and non-syntenic genes per bin whereas the percentage of genes found in islands versus isolated is indicated for each bin on the right end side. Bins are represented with the following color code:C-1BL11-0.23 deletion bin in purple, the 1BL11-0.23-0.32 in pink,1BL6-0.32-0.47 in blue, 1BL1-0.47-0.61 in light blue, 1BL14-0.61-0.69 in green, 1BL2-0.69-0.74 in light green, 1BL8-0.74-0.85 in yellow,1BL3-0.85-0.89 in orange and 1BL4-0.89-1.00 in red. In wheat, chromosomes of group 1 originate from the fusion between the ancestral proto-chromosomes A5 and A10 [40]. The parts of chromosome 1BL that originated from proto-chromosome A10 and A5 are marked by dark grey and light grey boxes, respectively.
