Figure 3.
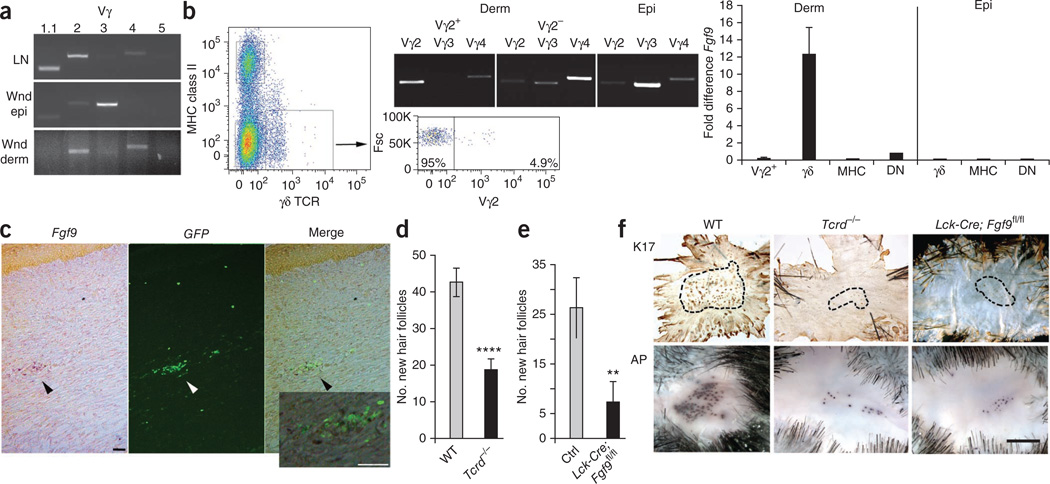
Fgf9, secreted by wound dermal γδ T cells, is an important component of WIHN. (a) RT-PCR analyses of lymph node cells (LN), wound epidermis (Wnd epi) and wound dermis (Wnd derm) for rearranged Vγ variable regions Vγ1.1, Vγ2, Vγ3, Vγ4 and Vγ5 (n = 4). Results are representative of three independent experiments. (b) Left, pseudocolor density dot plot of PWD12 dermal cells sorted for expression of MHC class II and γδ TCR. The lower boxed population represents cells that were further sorted for Vγ2 expression (right dot plot) and forward scatter (Fsc). Middle, RT-PCR analysis of sorted Vγ2+ and Vγ2− populations from dermis (Derm) and sorted γδ T cells from wound epidermis (Epi) for Vγ2, Vγ3 and Vγ4 to determine purity of each population. Right, qPCR analyses of sorted Vγ2+ γδ T cells (Vγ2+), all other γδ T cells (γδ), MHC class II+ cells (MHC) and nonstaining double-negative cells (DN) in wound dermis (left) or γδ, MHC and double-negative cells in wound epidermis (right) for Fgf9 expression. For these experiments, wound dermis or epidermis from 20–40 mice was combined and sorted. Results are representative of three independent experiments. (c) In situ hybridization for Fgf9 expression in a Tcrd-H2BEGFP wound frozen section. Left image (Fgf9) shows in situ hybridization for Fgf9 expression in a PWD11 frozen section. Dark purple dots (black arrowhead) represent Fgf9+ cells in the dermis. Middle image (GFP) shows location of GFP-expressing γδ T cells (white arrowhead) within the same section. Right image (Merge) shows overlap of left and middle images. Scale bar, 75 µm. The inset represents a magnified view of the region indicated by the black arrowhead in right image. Scale bar, 75 µm (n = 12). Results are representative of four independent experiments. Probe specificity is illustrated in Supplementary Figure 7b. (d) Number of new hair follicles in wounds of WT control and Tcrd−/− mice. WT mice: n = 37; Tcrd−/− mice: n = 50. Data represent combined results of eight independent experiments. (e) Number of new hair follicles in wounds of Lck-Cre; Fgf9fl/fl and control (Ctrl) mice. Lck-Cre; Fgf9fl/fl mice: n = 17; single-transgene control mice: n = 30. Data represent combined results of seven independent experiments. (f) Representative whole-mount preparations of wound epidermis from WT, Tcrd−/− and Lck-Cre; Fgf9fl/fl mice stained for Keratin 17 (K17) and dermis stained for alkaline phosphatase activity (AP). Black dashed lines represent borders of areas with new hair placodes. Scale bar, 1 mm. Data are expressed as means ± s.e.m. **P < 0.01, ****P < 0.001 compared to controls, calculated using two-tailed Student’s t test.

