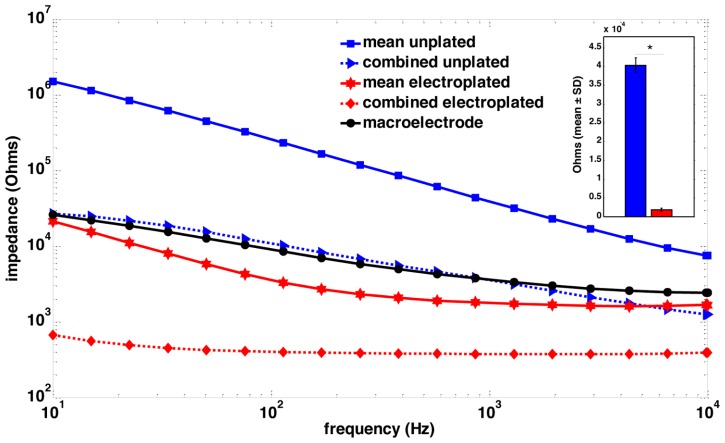
FIGURE 2.
Impedance spectroscopy of macroelectrode, microelectrode array and sonicoplated microelectrode array. Impedance spectra of a single macroelectrode (black), the mean impedance of a plated (red) and an unplated (blue) microelectrode array, and the combined impedance of 15 plated (red, dotted) and unplated (blue, dotted) microelectrodes that were connected in parallel for stimulation. The inset shows a bar graph representation of the mean ± SD of the impedance plots at 1 kHz, of the 15 microelecrodes before (blue) and after (red) electroplating. *P < 0.05.

