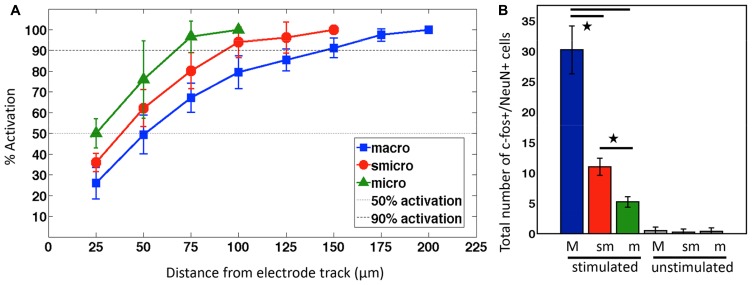
FIGURE 5.
Neuronal activation density and total number of neurons activated. (A) Mean ± SD percentage of neuronal activation% in 25 μm radius increments surrounding implanted and stimulated electrodes. (B) Bar graphs showing the mean ± SD number of c-fos+/NeuN+ cells with macroelectrode (M), sonicoplated microelectrode (sm), or unplated microelectrode (m), with and without stimulation. *P < 0.05.

