
Figure 5.
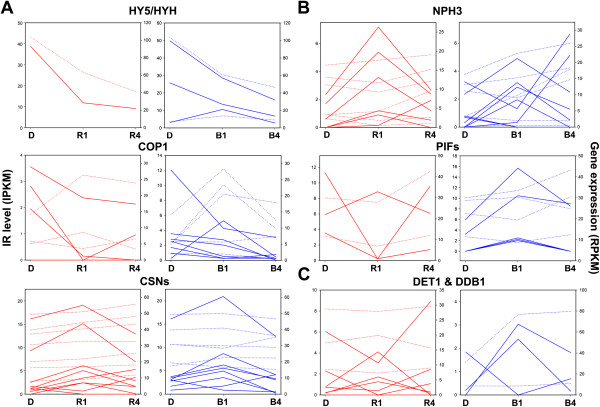
IR of light signaling genes in response to red and blue light. Expression profiles of red (left) and blue (right) light-regulated IR isoforms and corresponding genes of light signaling genes are shown. IPKM of IR transcripts (solid line) and RPKM of corresponding genes (dashed line) in dark-grown (D), 1-h light-treated (R1 and B1), 4-h light-treated (R4 and B4) samples were calculated and plotted. Events were arranged according to IR patterns of the gene families under red and blue lights. (A) Gene families showing a relatively consistent pattern among members under both red and blue lights. (B) Gene families showing a diverse pattern among members under their acting light conditions. (C) Gene families showing a diverse pattern among members under both light conditions. Note that some of the IR events occurred in transcripts of the same gene, therefore having the identical RPKM as overlapping dashed lines.