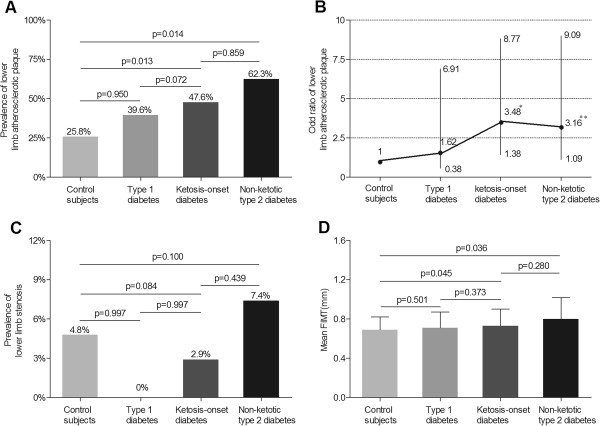
Figure 1.

Comparison of lower limb atherosclerotic lesions among the four groups after adjusting for age and sex. (A) Comparison of the prevalence of lower limb atherosclerotic plaque among the four groups. The p-value for four group comparisons was 0.013. (B) Odd ratio of lower limb atherosclerotic plaque for the type 1, ketosis-onset and non-ketotic type 2 diabetic subjects in comparison to control subjects without diabetes. The bars represent the 95% confidence interval. Compared with control subjects, where *p = 0.002 and **p = 0.041. (C) Comparison of the prevalence of lower limb stenosis among the four groups. The p-value for four group comparisons was 0.167. (D) Comparison of the mean FIMT among the four groups. The p-value for four group comparisons was 0.015.
