
Figure 4.
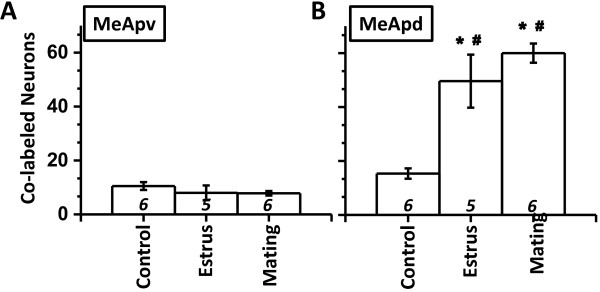
Colabeling in MePV and MePD. Cell counts of colabeled neurons () in MePV (A) and MePD (B). *, p < 0.05, post-hoc comparison between experimental treatments within a particular sub-nuclei. #, p < 0.05, post-hoc paired comparison between sub-nuclei for a particular experimental treatment.