
Figure 5.
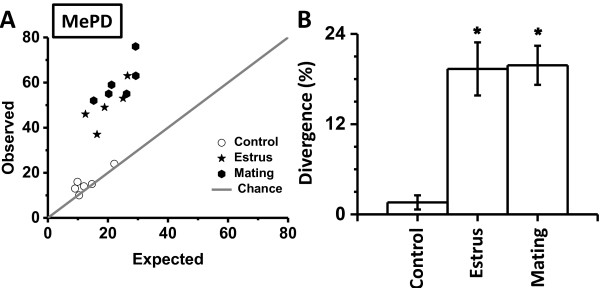
Departure of observed colabeling from theoretical prediction. Expected and observed values of colabeled neurons in the MePD (A). Expected probability (abscissa) was calculated as product of individual probabilities for FOS and AVP neurons. The diagonal gray line from the origin depicts chance level (expected probability equals observed probability). Divergence of observed values from the chance (B). Divergence was calculated for each Cartesian point in panel A by dividing (x-y)2 with (x + y)2. Divergence is expressed as percentage on the ordinate. *p < 0.05, post-hoc comparison between experimental treatments.