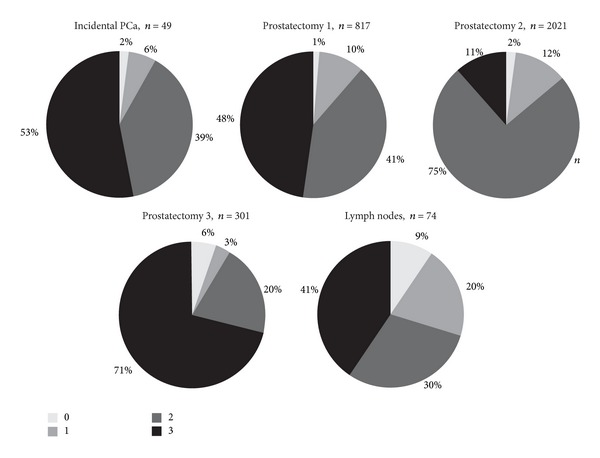
Figure 2.

Frequency of CD57 staining scores in prostate cancers from five different TMAs expressed as percentage. Each circle diagram depicts one TMA. The staining scores from 0 to 3 correspond to the different sections from light-grey (score 0) to black (score 3).
