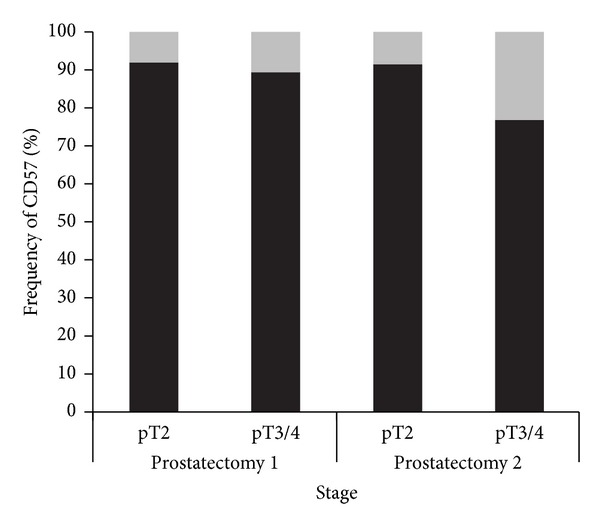
Figure 3.

Correlation of CD57 expression in the TMAs “prostatectomy 1 and prostatectomy 2” with T-classification. T-classification and staining patterns were dichotomised into the prognostically relevant categories pT2 versus pT3/4 and absent/low (grey) and moderate/strong (black) CD57 staining, respectively. Differences are statistically significant with the χ²-test in the TMA “prostatectomy 2” (P < 0.0001), but not in the TMA “prostatectomy 1” (P = 0.307).
