


Figure 2.
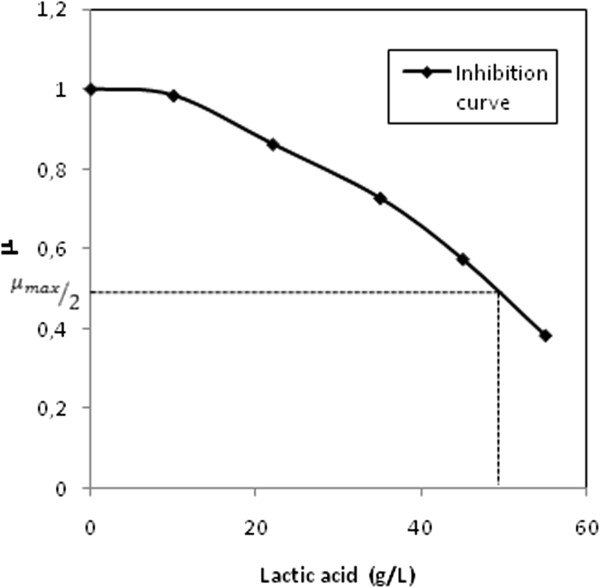
Lactate inhibition curve. The graph shows the specific growth rate of L. crispatus L1 using increasing concentrations of sodium lactate in the medium at pH 6.5.
Official websites use .gov
A
.gov website belongs to an official
government organization in the United States.
Secure .gov websites use HTTPS
A lock (
) or https:// means you've safely
connected to the .gov website. Share sensitive
information only on official, secure websites.
Lactate inhibition curve. The graph shows the specific growth rate of L. crispatus L1 using increasing concentrations of sodium lactate in the medium at pH 6.5.