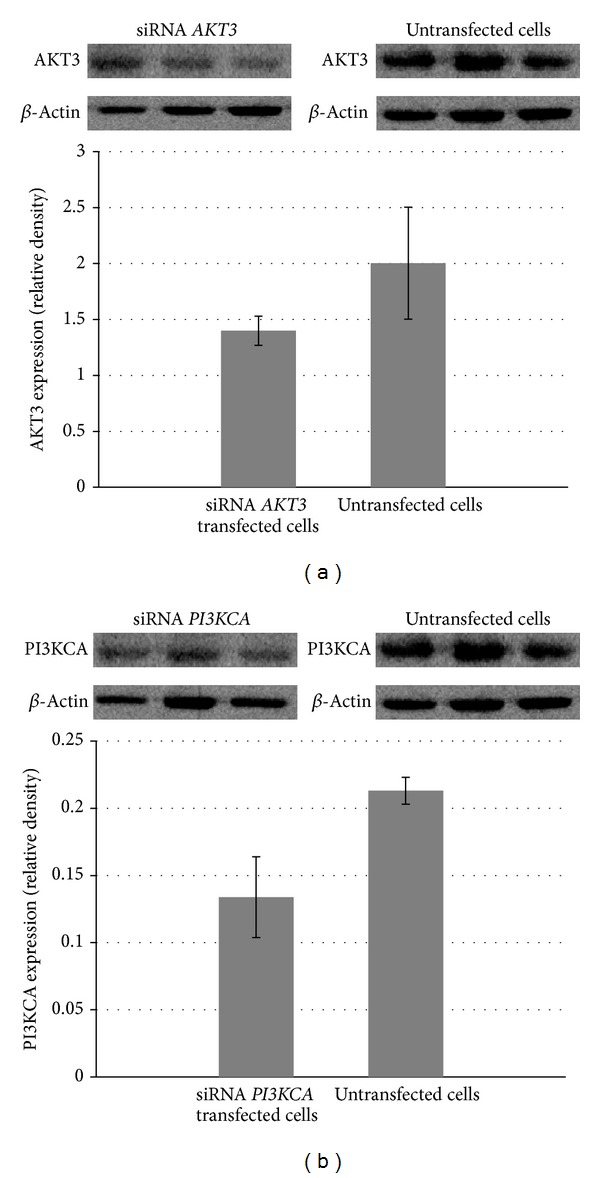
Figure 3.

Reduction in the AKT3 and PI3KCA protein expression in T98G cells after AKT3 and PI3KCA knockdown compared to untransfected cells. All of the figures are representative of three independent experiments. Data are expressed as means ± SEM (P < 0.05).
