Figure 7.

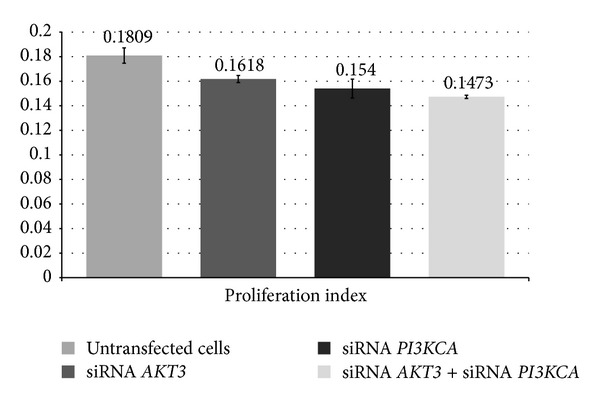
Comparison of the proliferation index between cells that had been transfected with AKT3, PI3KCA, or AKT3 + PI3KCA siRNAs and untransfected cells (P < 0.05).

Comparison of the proliferation index between cells that had been transfected with AKT3, PI3KCA, or AKT3 + PI3KCA siRNAs and untransfected cells (P < 0.05).