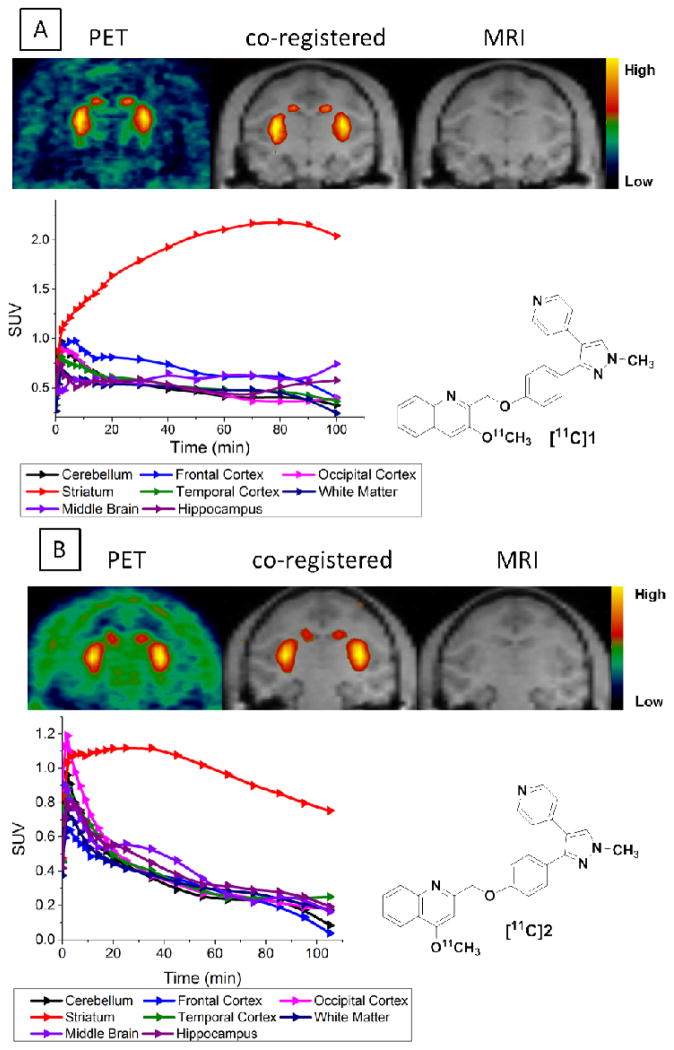
Figure 3.
MicroPET studies of [11C]1 (A) and [11C]2 (B) in an adult male cynomolgus monkey. Upper panel: MicroPET images (left), co-registered images (middle) and MRI images (right). High uptake of [11C]1 and [11C]2 in striatum produced clear visualization of tracer in putamen and caudate; low panel: tissue time activity curves for cerebellum (black), frontal cortex (blue), occipital cortex (magenta), striatum (red), temporal cortex (olive), white matter (navy), middle brain (violet), and hippocampus (brown).

