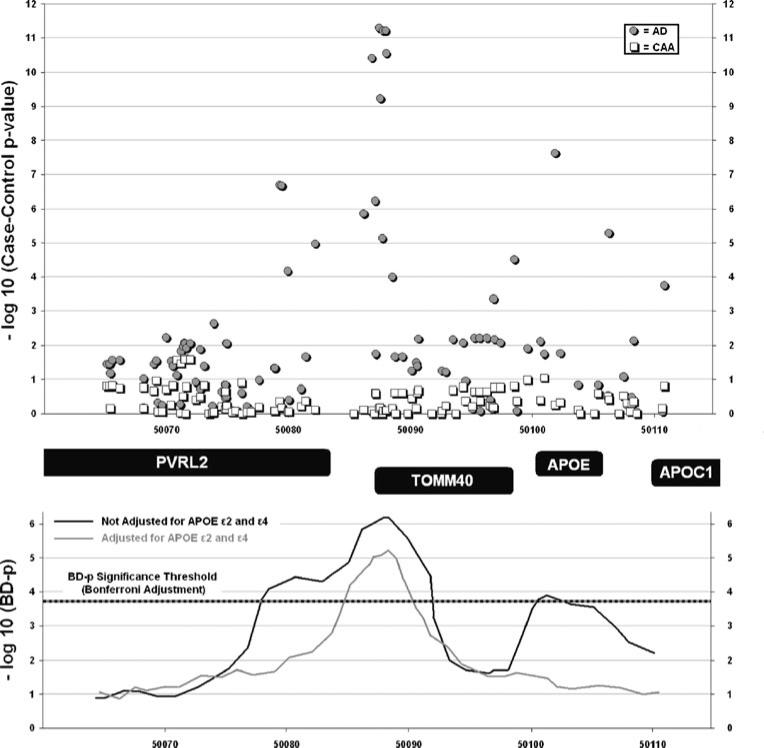
Fig. 3.
Effect heterogeneity for association of SNPs in the 19q13.2 region. Top panel: negative log of p values for case–control AD/CAA association are plotted against physical position at the 19q13.2 locus using genotypes derived exclusively from genome-wide arrays and imputation as described above. Bottom panel: negative log of p values for the heterogeneity of effects tests (BD) are displayed against physical position at the 19q13.2 locus. The multiple-testing adjusted threshold for BD significance is calculated for 235 independent tests. Reported values refer to BD results for BD-p<0.05 before and after adjustment for APOE ε2 / ε4 genotype. AD=Alzheimer's disease, BD=Breslow–Day, CAA=cerebral amyloid angiopathy

