
Figure 5.
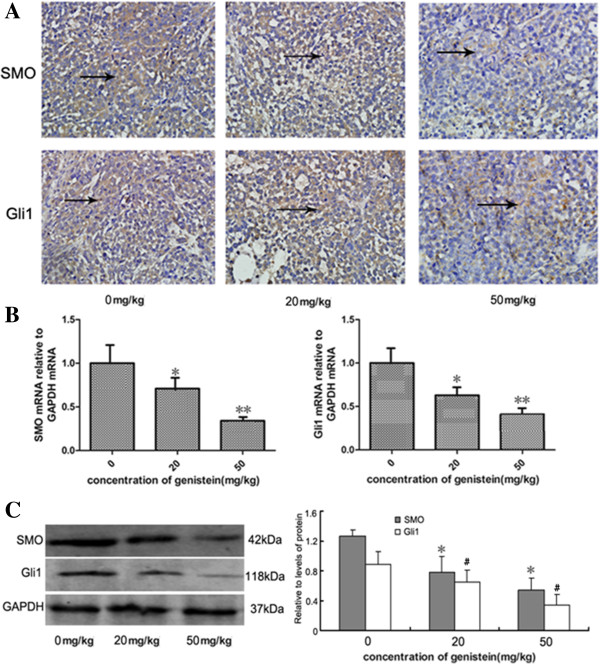
Hedgehog–Gli1 pathway inhibition by genistein in vivo. (A) Immunohistochemistry staining with human Smoothened (SMO) and Gli1 antibodies (brown in cytoplasm), ×200. (B) Real-time polymerase chain reaction analysis of SMO and Gli1 in mice tumors. (C) Smo and Gli1 protein level in tumor tissue and accompanied by a quantitative bar chart. Data presented as mean ± standard deviation, n = 5. *P <0.05, **P <0.01, Student’s t test. Each condition was repeated three times and error bars represent standard deviations. GAPDH, glyceraldehyde 3-phosphate dehydrogenase.