
Figure 3.
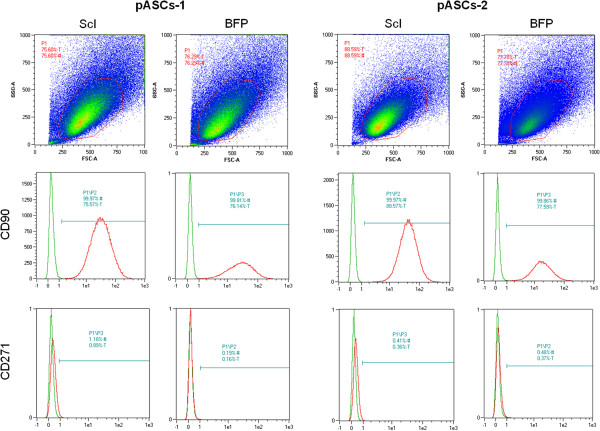
FACS analysis of ScI- and BFP-pASCs. Expression of specific mesenchymal stem cell markers in ScI- and BFP-pASC populations (n = 2). Size and granularity are shown (upper panels). pASCs stained for CD90 and CD271 are reported (lower panels).