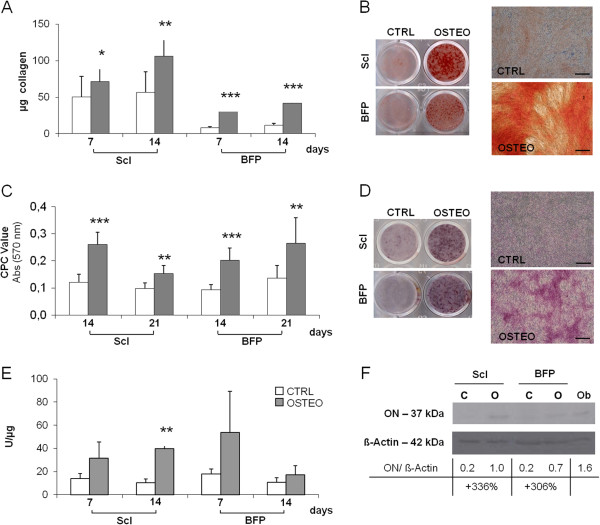
Figure 4.

Osteogenic potential of pASCs. Quantification of collagen (A), calcified extracellular matrix (ECM) deposition (C), alkaline phosphatase (ALP) activity (E) in undifferentiated (CTRL, white bars), and osteo-differentiated (OSTEO, dark bars) ScI- and BFP-pASCs; data are expressed as mean ± SEM (n = 12). OSTEO versus CTRL *P < 0.05; **P < 0.01; ***P < 0.001. Images of ScI- and BFP-pASC wells stained with Sirius Red (B, left panel) and Alizarin Red-S (D, left panel) and representative microphotographs of ScI-pASCs (B, D, right panel, optical microscopy, 40× magnification; scale bar, 200 μm). Osteonectin expression of ScI-pASCs and BFP-pASCs analyzed with Western blot; its quantification, normalized to β-actin, is also indicated (F).
