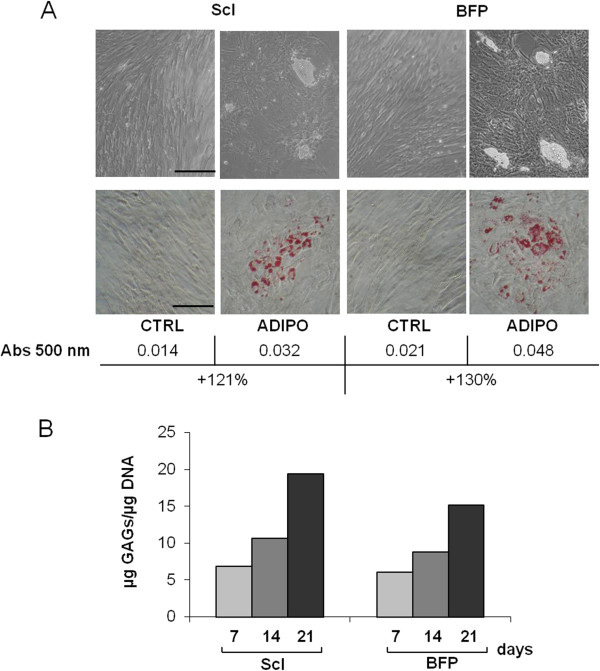
Figure 5.

Adipogenic and chondrogenic potential of pASCs. Microphotographs of BFP-pASCs and ScI-pASCs maintained for 14 days in control (CTRL) and adipogenic medium (ADIPO; 200× magnification; scale bar, 50 μm), both during culture (A, upper panels) and after lipid vacuoles staining by Oil Red O (B, middle panels). Quantification of lipid vacuoles formation by Oil Red O extraction is shown in A, lower panel. Quantification of glycosaminoglycans (GAGs) production normalized on DNA content in CHONDRO-pASCs after 7, 14, and 21 days of differentiation in pellet culture (B).
