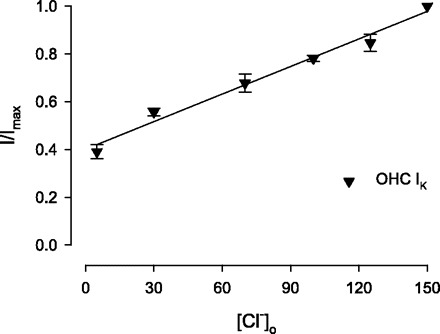
Fig. 2.

Concentration-response curve of external Cl− on magnitude of IK. Functions were obtained by substituting gluconate for Cl−. A linear fit (solid line) indicates an IK change of 0.4%/mM Cl−. I/Imax, the current amplitude during each test pulse normalized to maximal current; [Cl−]o, extracellular Cl− concentration; OHC, outer hair cells.
