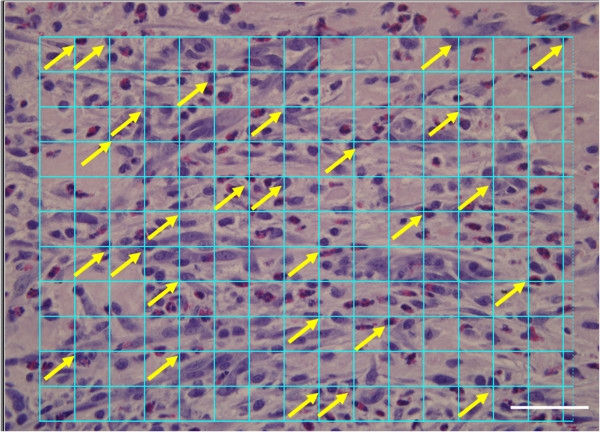
Figure 6.

Calculating the volume fraction of inflammatory cells using a 192 point grid. A representative image of a hematoxylin and eosin stained histological section demonstrates healing granulation tissue. This area is where neovascularization occurs. A grid is electronically generated and placed on the section. Arrows indicate examples of inflammatory cells on intersection of the grid. Scalebar = 50 μm.
