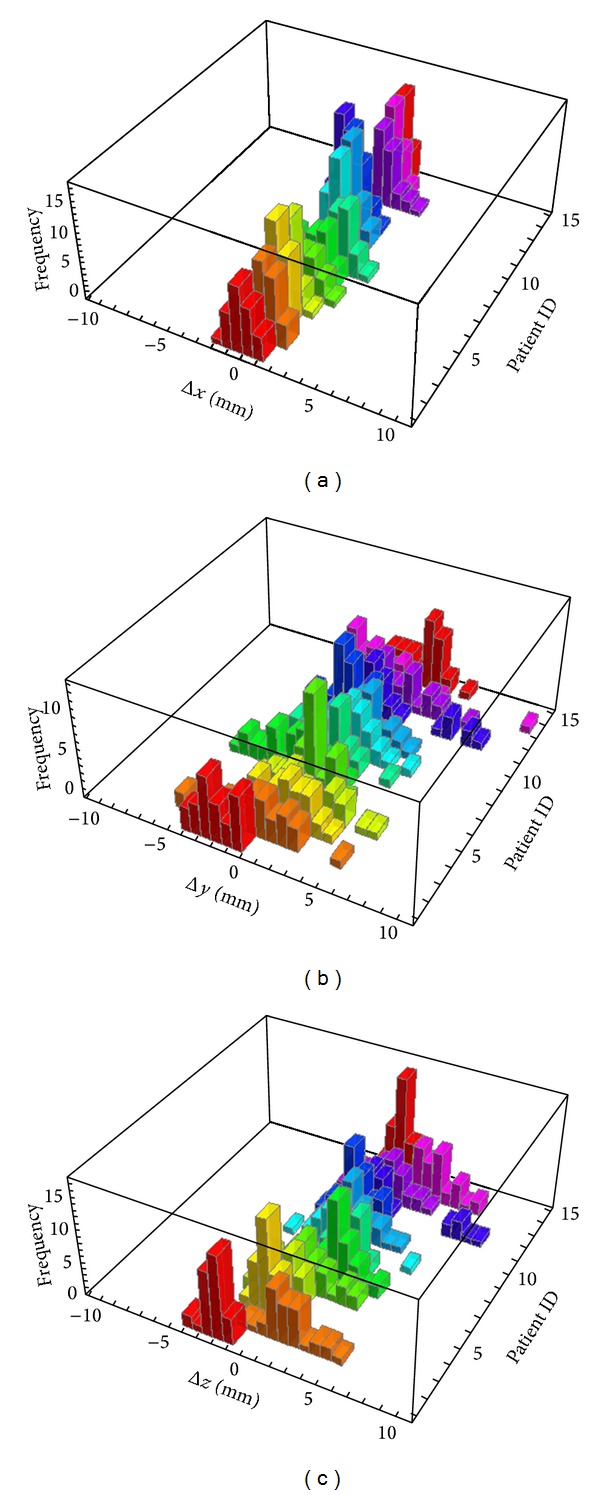
Figure 2.

Histograms of calculated localization errors relative to the planning CT isocenter in (a) x, (b) y, and (c) z directions for 14 prostate cancer patients, with x-axis going from left to right, y-axis going from anterior to posterior, and z-axis going from cranial to caudal directions.
