
Figure 4. macroH2A isoforms and H3K27me3 occupy pluripotency genes in DFs.
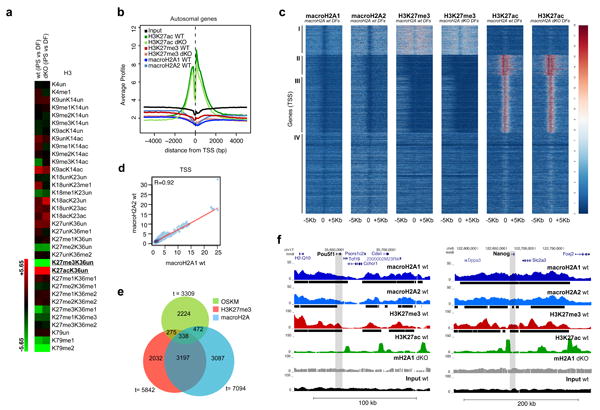
(a) qMS heatmap with H3 PTMs comparing iPS cells with DFs, in wt and mH2A dKO cells. H3K27me3 and H3K27ac are amongst the most striking changes upon reprogramming. Two technical replicates run for each of two biological samples. (b) Average signal (100bp window) of the ChIP-seq read counts normalized to total number of reads (counts per million reads), plotted against the distance (-5Kb, +5Kb), from the nearest annotated (USCS mm9) Transcription Start Site (TSS) of all autosomal genes. c) Heatmap of all annotated TSS (-5Kb, +5Kb) based on macroH2A1, macroH2A2, H3K27me3 and H3K27ac enrichment in wt and mH2A dKO DFs, with k-means clustering of all samples (k=4) allowing for four distinct classes of genes (I, II, III, IV). (d) Correlation plot of macroH2A1 and macroH2A2 ChIP-seq reads at the TSS of autosomal genes in wt DFs. Pearson correlation value (R=0.92) indicates a strong correlation between macroH2A1 and macroH2A2. (e) Venn diagram representing genes enriched in H3K27me3, macroH2A-bound genes (combined macroH2A1 and macroH2A2 targets) and bound by at least one of the four (OSKM) factors37. (f) ChIP-seq profiles (UCSC browser) of two major pluripotency genes (Pou5f1 (Oct4) and Nanog) for macroH2A1, macroH2A2, H3K27me3 and H3K27ac; grey bar represents the gene body region. Chromatin ‘domains’ identified with Sicer annotated under each profile (black bar); macroH2A1 ChIP-seq in dKO DFs and Input used as controls.