
Figure 2. FACS analysis of pulmonary B cells in Ad-mOSM treated mouse lungs.
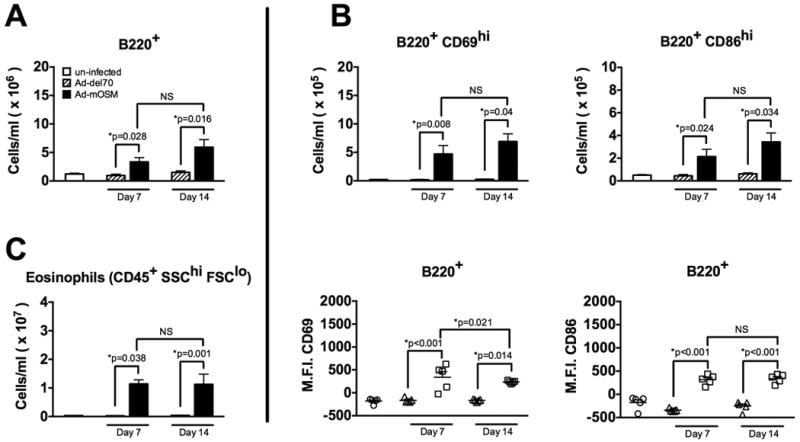
A. B220+ B cells were enumerated by flow cytometry on days 7 and 14 after inoculation with Ad-mOSM, Ad-del70 or PBS. B. Expression of the activation markers CD69 and CD86 were examined on lung B220+ B cells from un-infected, day 7 and day 14 Ad-del70- or Ad-OSM-infected (top panels in B). Mean fluorescence intensity (M.F.I.) for CD69 and CD86 expression on B220+ cells is shown (bottom panels in B). C. Eosinophils were enumerated by flow cytometry in the same lung tissues. CD45+ live cells in the high side scatter (SSC) and low forward scatter (FSC) gate were identified as eosinophils, whereas CD45+ live cells with a low SSC and low FSC profile were identified as lymphocytes. Total numbers for B220+ B cells, CD69- and CD86 high-expressing (hi) cells, B220+ CD86-hi cells and eosinophils (CD45+ SSC-hi FSC-lo) are shown. Results are presented as the means ± SEMs of at least five mice per group. Data shown is representative of at least two separate experiments.