
Figure 6.
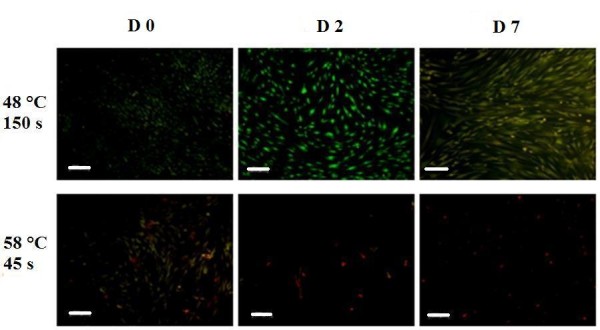
Calcein staining for viable and dead cells over time using fluorescence microscopy. Comparison between the 48°C/150 seconds and 58°C/45 seconds groups showing that the threshold for cell survival lies between these two conditions. Cells stained green are viable and cells stained red are dead. Scale bar = 200 μm.