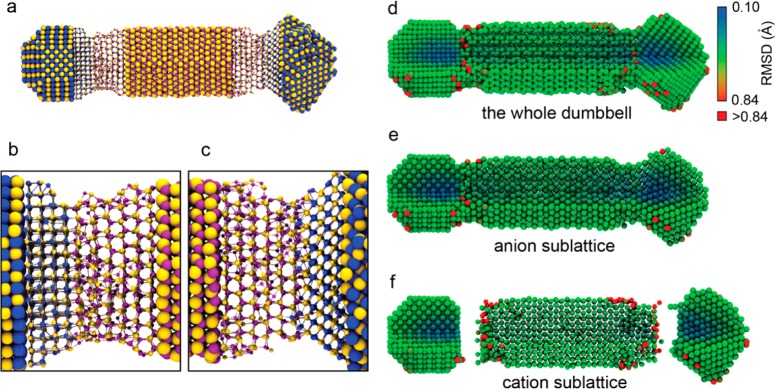
Figure 3.

Force-field MD simulations of the PbSe-CdSe nanodumbbells. (a) Overview image showing the final configuration of a dumbbell obtained after MD simulation at a temperature of 500 K for 5 ns. The ball–stick presentation was used to show the structure of the interfaces. The yellow, purple, and blue spheres are Se, Cd, and Pb atoms, respectively. (b) Magnified image of the {100}PbSe/{0001}CdSe interface at the left-hand side of the dumbbell, and (c) magnified image of the {0001}CdSe/{111}PbSe interface at the right-hand side of the dumbbell. (d,e,f) The map of the root mean square displacement (RMSD) for each atom for the same PbSe-CdSe dumbbell model at 500 K. (d) The whole PbSe-CdSe dumbbell, (e) the anion sublattice, and (f) the cation sublattice. The dumbbell was cut so that both of the surface and inner atoms can be seen. The pure red atoms correspond to those having a RMSD larger than 0.84 Å.
