
Figure 3.
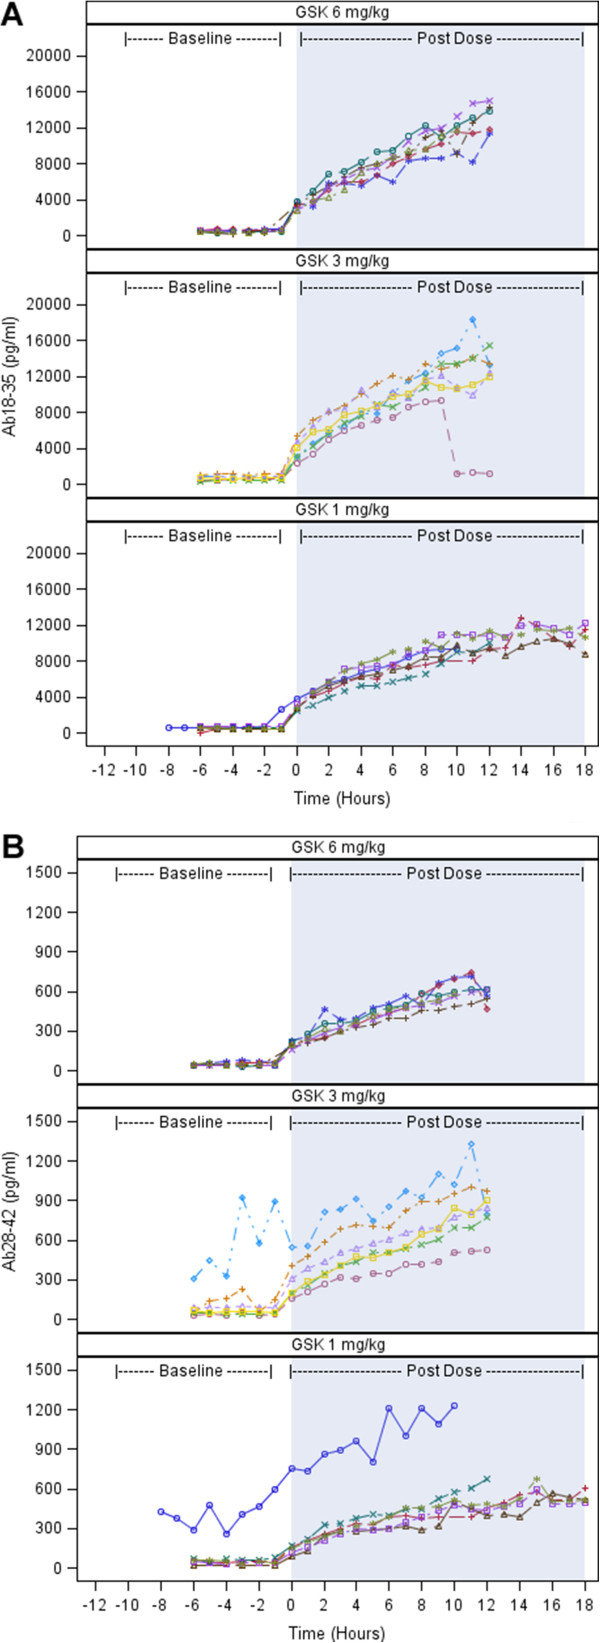
Plots illustrating total plasma β-amyloid levels of individual patients by time and dose level. (A) β-amyloid (18–35) Aβ18–35. (B) Aβ28–42. GSK: GSK933776. Patients = 6 for each dose group.
Official websites use .gov
A
.gov website belongs to an official
government organization in the United States.
Secure .gov websites use HTTPS
A lock (
) or https:// means you've safely
connected to the .gov website. Share sensitive
information only on official, secure websites.
Plots illustrating total plasma β-amyloid levels of individual patients by time and dose level. (A) β-amyloid (18–35) Aβ18–35. (B) Aβ28–42. GSK: GSK933776. Patients = 6 for each dose group.