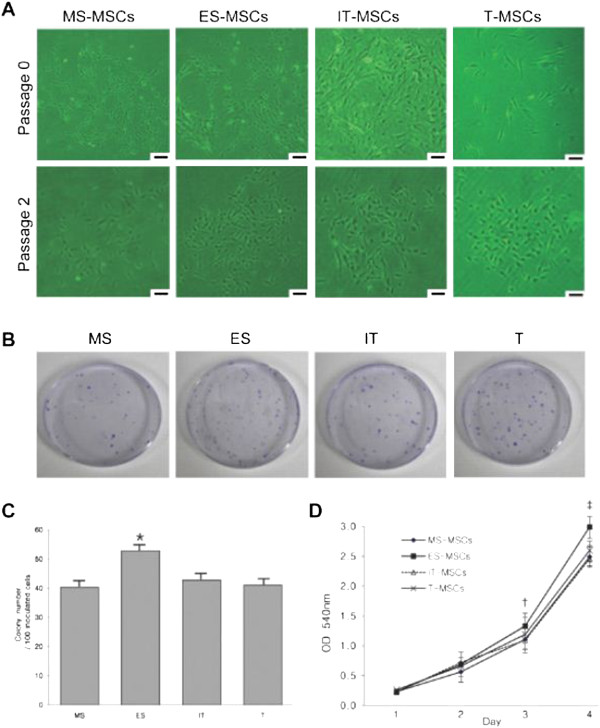
Figure 1.

Isolation characteristics and proliferation capability. (A) The fibroblast-like morphology of MPCs is shown after initial plating and at passage 2 (original magnification 100×, scale bar = 30 μm). (B) A total of 100 adherent cells were cultured in 60 cm2 dishes for seven days and stained with 0.5% crystal violet. (C) The colony number per adherent cells was significantly higher in ES than IT, MS and T. (D) ES-MPCs proliferated at a faster rate compared with MS-, IT and T-MPCs at days 3 and 4 by MTT assay. Data are expressed as the mean ± SEM. * P = 0.004, †P = 0.001, ‡ P <0.001. ES, ethmoid sinus; IT, inferior turbinate; MPCs, mesenchymal progenitor cells; MS, maxillary sinus; T, tonsil.
