
Figure 4.
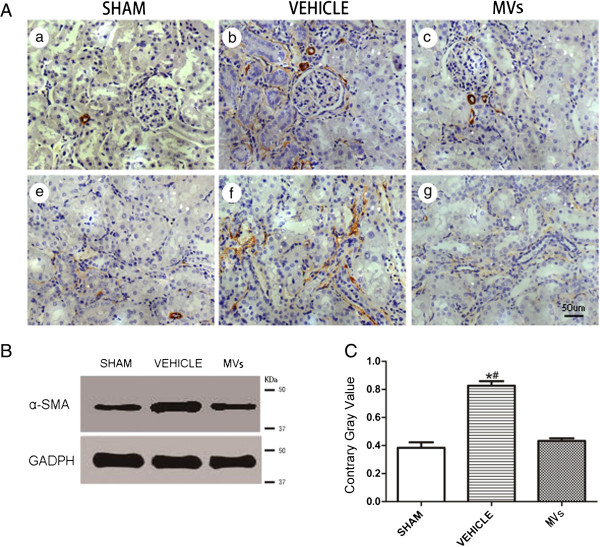
hWJMSC-MVs reduce the α-smooth muscle actin (α-SMA) expression in kidney tissues. (A) Representative micrographs illustrating α-smooth muscle actin (α-SMA) expression in kidney tissues, In comparison with MVs group, the vehicle group exhibited stronger positive staining for α-SMA in kidney tissue sections at two weeks (the original magnification is 400×, Scale bar = 50 um). (B, C) α-SMA expression in kidney tissues was measured by Western blot analysis, and MVs dramatically reduce the α-SMA expression, all quantitative data are shown as mean ± SD of three experimental conditions (n = 3, *P <0.05, sham versus vehicle; #P <0.05, MVs versus vehicle).