
Figure 1.
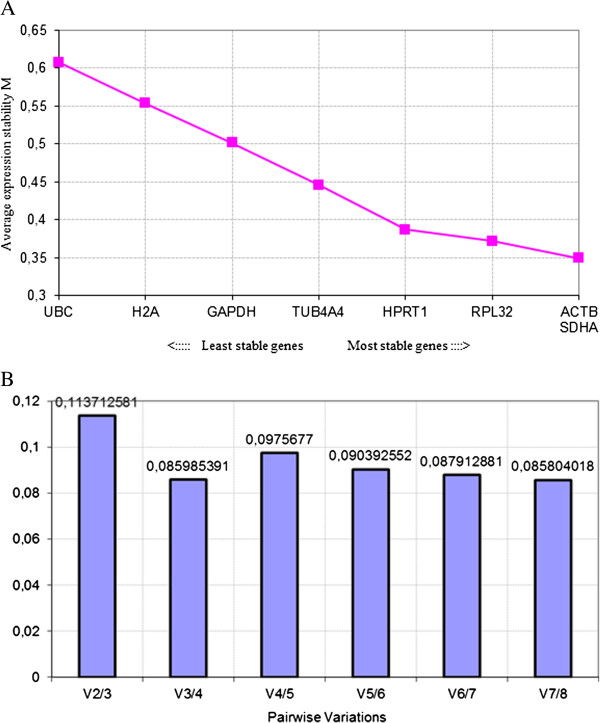
Determination of the stability and number of reference genes. (A) Average expression stability values of eight commonly used reference genes. (B) Determination of the optimal number of reference genes to be used for normalization. The Y-axis represents the pairwise variation value V between the normalization factors NFn and NFn + 1. Pairwise variation values are calculated for every series of NFn and NFn + 1 normalization factors, reflecting the effect of adding an (n + 1)th gene.