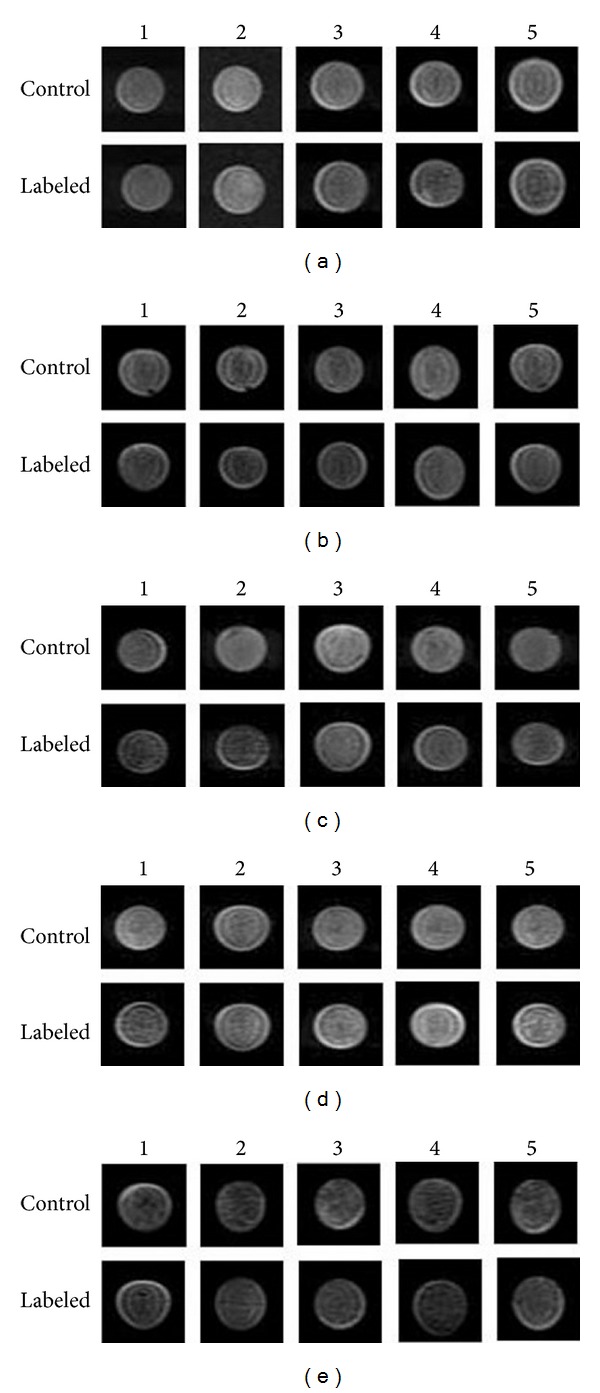
Figure 2.

MR images of labeled cells in agar (1 × 10⁶ cells) acquired using T2-weighted imaging with the FRFSE sequence. (a)–(e) indicate the iron ion concentration (from 8.4 to 21 μg/mL, resp.). The numbers 1–5 represent the iRGD peptide concentration (from 0.25 to 1.25 μg/mL, resp.).
