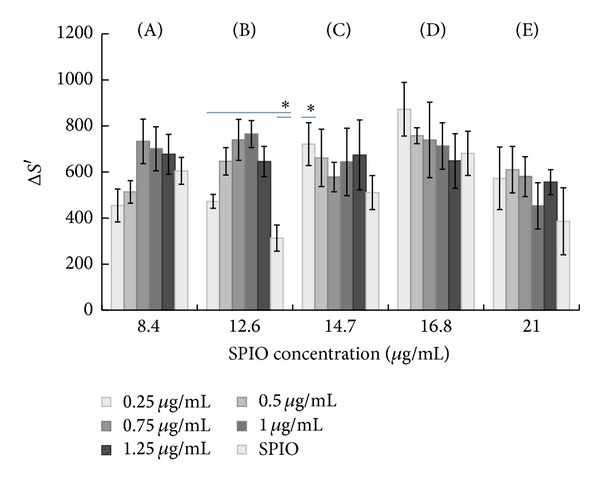
Figure 4.

The evaluation of the mean signal reduction values (ΔS′) for different iron concentrations. For the iron concentration of 12.6 μg/mL, a significant difference was found between the treatment and control groups (P < 0.05). For the iron concentration of 14.7 μg/mL, a significant difference was only found between 0.25 μg/mL iRGD and the control group. (A)–(E) indicate 8.4–21 μg/mL iron ion concentration. The SPIO group served as the control group. *P < 0.05.
