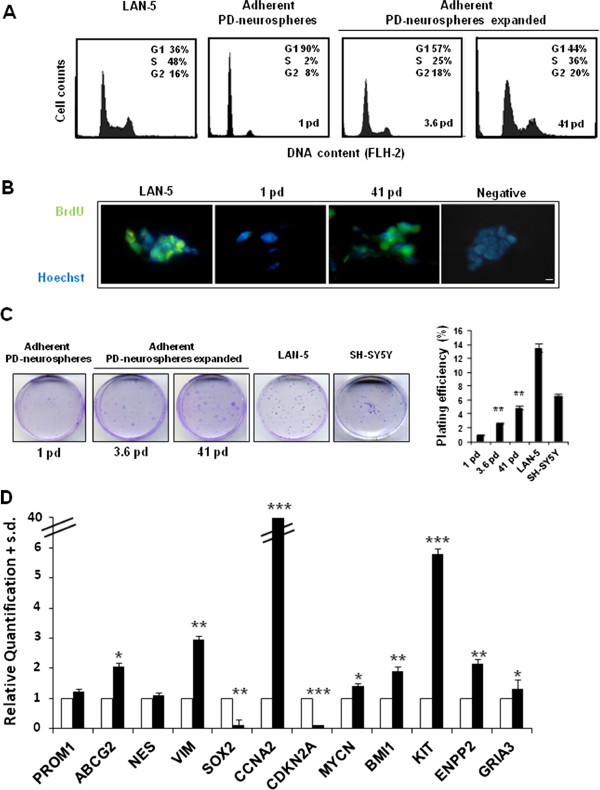
Figure 5.

Propagation and spontaneous transformation of secondary PD-neurospheres. A) Cell cycle FCM analysis in PD-neurospheres expanded for 3.6 and 41 pd (3 and 19 passages, respectively). The unexpanded secondary PD-neurospheres are also shown (1 pd, 0 passages). As a control of cell proliferation of an established cancer cell line we used LAN-5 cells. B) Representative fluorescent images of PD-neurospheres expanded for 41 pd. Green, BrdU immunostaining and blue, HOECHST. Scale bar: 20 microns. C) Left, images of the in vitro colonies obtained in secondary PD-neurospheres (1 pd) and in PD-neurospheres at different passages of expansion (3.6 and 41 pd) seeded at clonal density and evaluated after 15 days of culture. Right, plating efficiency values (+SD; n = 5) in the same samples. As positive control we used the LAN-5 and SH-SY5Y cell lines. Statistical significance: **P <0.01. D) Levels of the indicated mRNA in PD-neurospheres expanded for 41 pd (black). The data are reported as the level of mRNA relative to the secondary PD-neurospheres (white) and are the means + SD (n = 3). Statistical significance: *P <0.05; **P <0.01; ***P <0.001. BrdU, bromodeoxyuridine; FCM, flow cytometry; PD, placenta-derived; pd, population doubling; SD, standard deviation.
