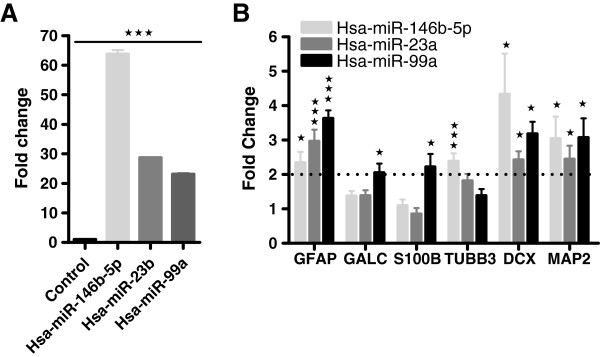
Figure 4.

MiRNA mimic transfection analysis. A) hsa-miR-146b-5p, hsa-miR-23b, hsa-miR-99a transfected mimics were measured by real-time RT-PCR, and expressed as fold change compared with GFP transfected hNSCs (control). B) QRT-PCR molecular analysis for neuronal (TUBB3, DCX, and MAP2) and glial (GALC, GFAP, and S100B) markers of 146b-5p, hsa-miR-23b, hsa-miR-99a mimic transfected hNSCs and expressed as fold change compared with GFP transfected hNSCs (control). Statistical analysis was performed against transfected control; ± SDMs, *p < 0.05, **p < 0.001, ***p < 0.005, Student’s t-test.
